Review of 'Q- and A-learning Methods for Estimating Optimal Dynamic Treatment Regimes'
Phillip J. Schulte, Anastasios A. Tsiatis, Eric B. Laber, and Marie Davidian
By Joowon Lee in Causal Inference
October 5, 2022
R Markdown
This is an R Markdown document. Markdown is a simple formatting syntax for authoring HTML, PDF, and MS Word documents. For more details on using R Markdown see http://rmarkdown.rstudio.com.
You can embed an R code chunk like this:
summary(cars)
##      speed           dist
##  Min.   : 4.0   Min.   :  2.00
##  1st Qu.:12.0   1st Qu.: 26.00
##  Median :15.0   Median : 36.00
##  Mean   :15.4   Mean   : 42.98
##  3rd Qu.:19.0   3rd Qu.: 56.00
##  Max.   :25.0   Max.   :120.00
fit <- lm(dist ~ speed, data = cars)
fit
##
## Call:
## lm(formula = dist ~ speed, data = cars)
##
## Coefficients:
## (Intercept)        speed
##     -17.579        3.932
Including Plots
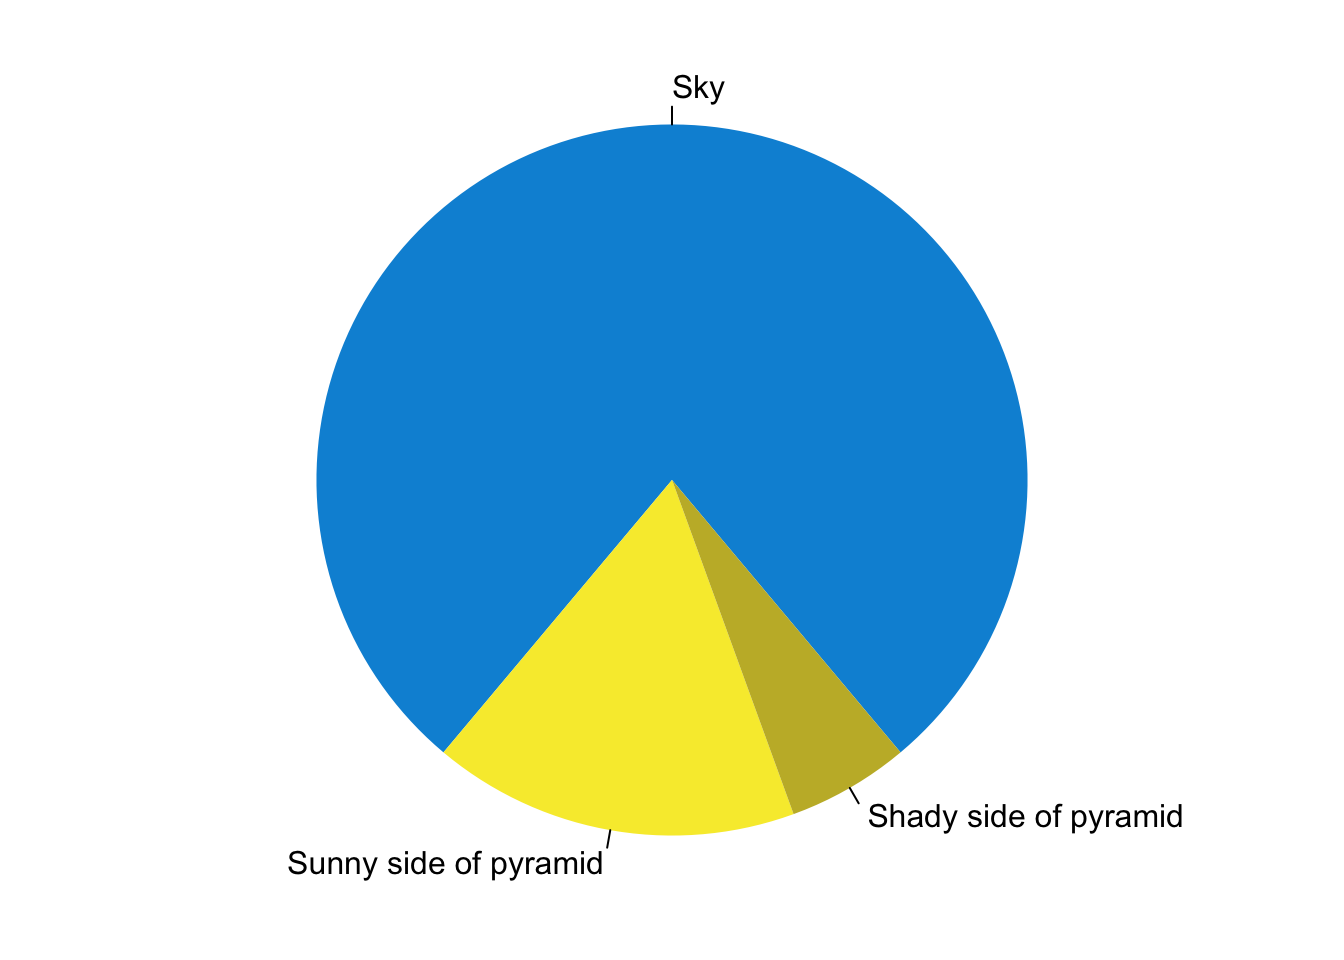
You can also embed plots. See Figure 1 for example:
par(mar = c(0, 1, 0, 1))
pie(
  c(280, 60, 20),
  c('Sky', 'Sunny side of pyramid', 'Shady side of pyramid'),
  col = c('#0292D8', '#F7EA39', '#C4B632'),
  init.angle = -50, border = NA
)
Figure 1: A fancy pie chart.